Weekly Market Snapshot: July 22 - August 11, 2022

This market calls for weekly updates.
August 5 - 11 Stats:
Average Sold Price: $831,021
Average %Difference List Price vs Sale Price: 96%
Average Days on Market: 16
July 29 - August 4 Stats:
Average Sold Price: $837,700
Average %Difference List Price vs Sale Price: 98%
Average Days on Market: 16
July 22 - 28 Stats:
Average Sold Price: $810,625
Average %Difference List Price vs Sale Price: 97
Average Days on Market: 19
These are the ‘dog days’ of summer! It’s not news anymore that the market has dropped from this years first quarter. August is traditionally one of the slowest months of the year because many people are taking holidays.
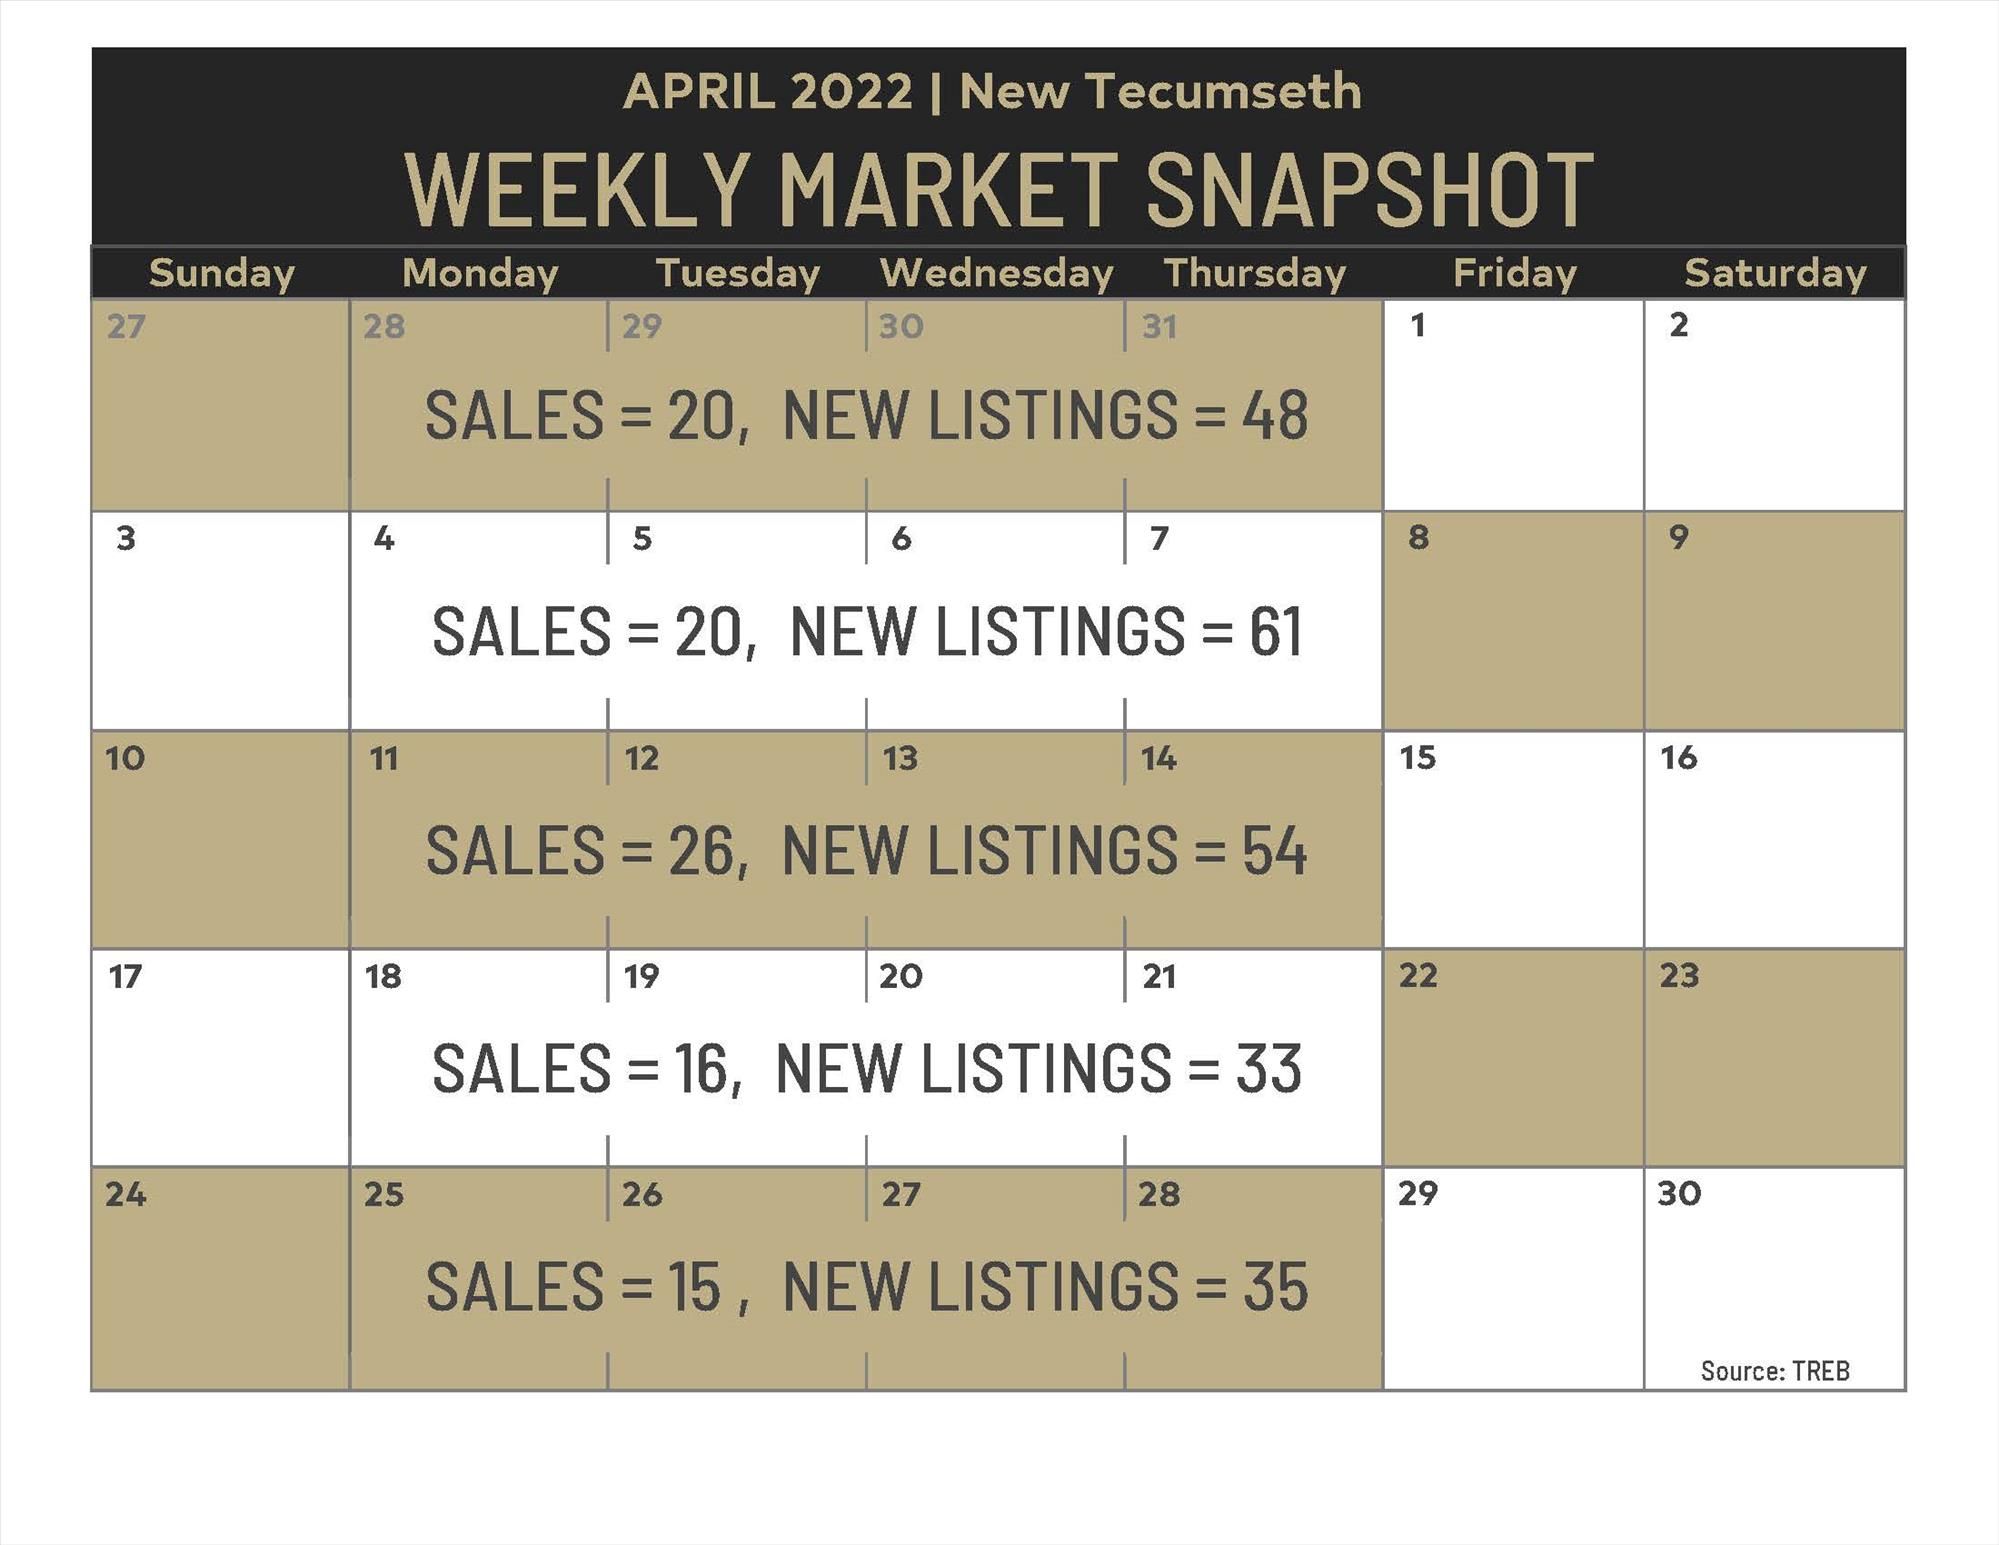
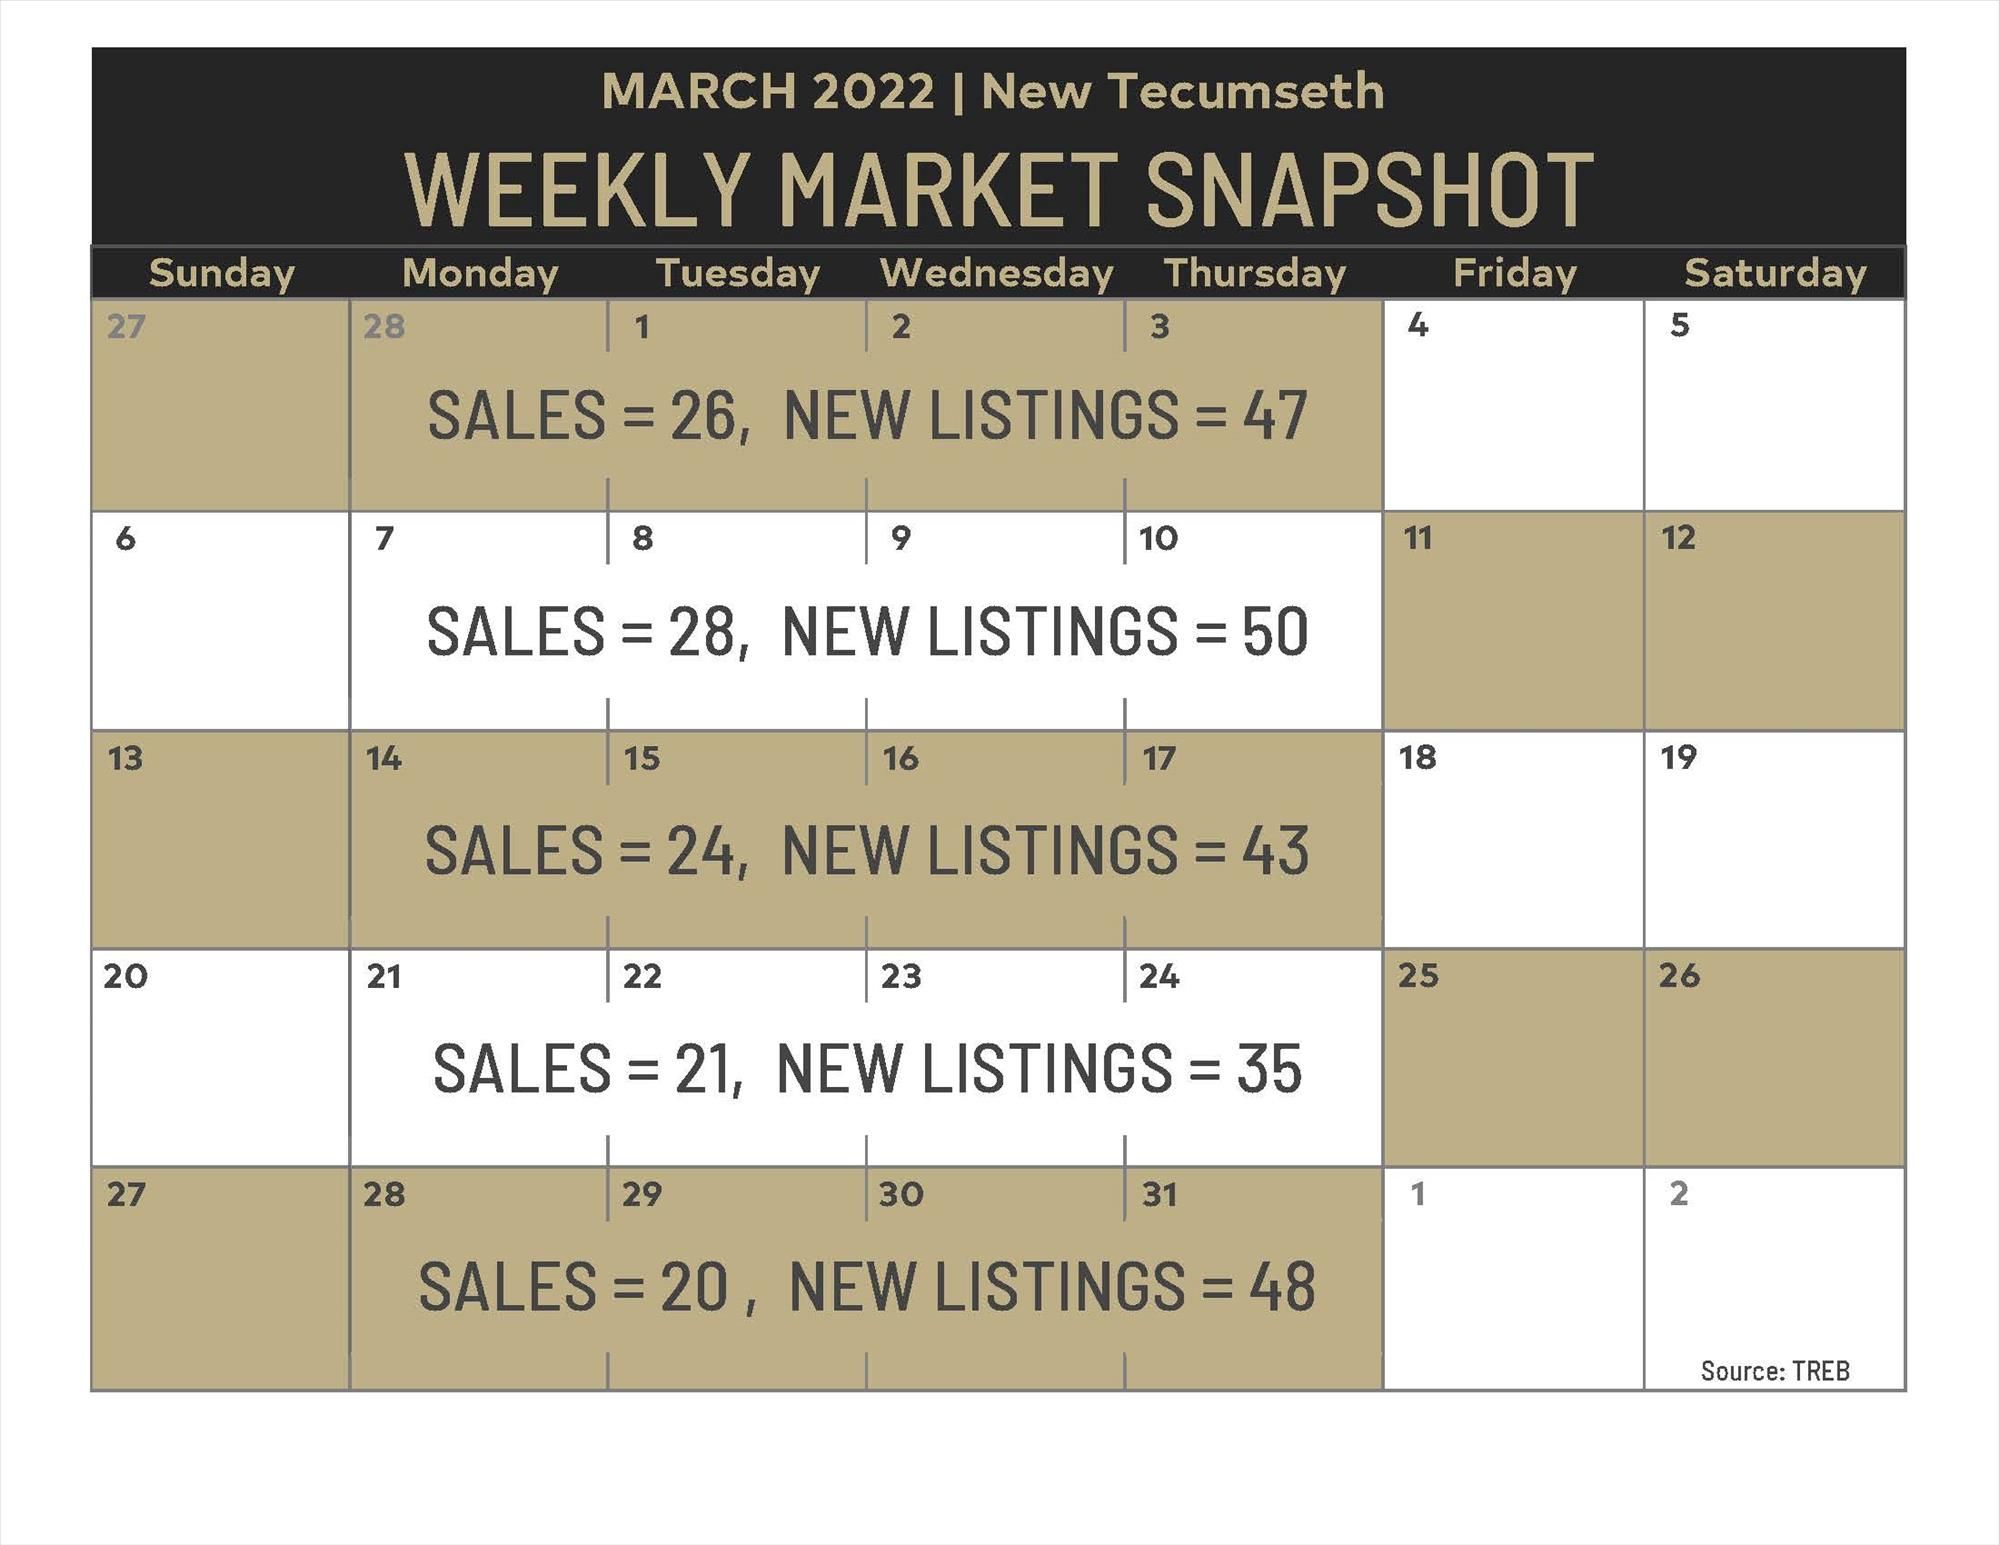
The trend continues of New Listings greatly outpacing Sales. Note that approximately 30% of these New Listings are actually ReLists (when a listing is relisted after being on the market for a while after is does not sell).
Weekly average prices are around the low $800s. Very little over $1M is selling.
Sales strategies have shifted now. Most properties listed around "market value" and sellers "accepting offers any time". Holding offers, Offer Nights and bidding wars with multiple offers is rare.
Selling in this market is more challenging. The nicest and best priced homes are selling the fastest. Avg Days On Market of the homes that are selling are below 20 days, which is reasonable.
Selling first, then buying maybe a consideration for people who are seeing lots of homes they are interested in. If you know anyone considering selling, have them contact me to discuss. An experienced, local professional should be your only consideration in this shifting market.
If you’re buying, tides have turned! Buyers now have options and time on their side. There are some good deals to be had.
Please let me know if I can help in anyway, I’m here to serve.
Be well everyone.


