Weekly Market Snapshot: March 18 - April 7, 2022
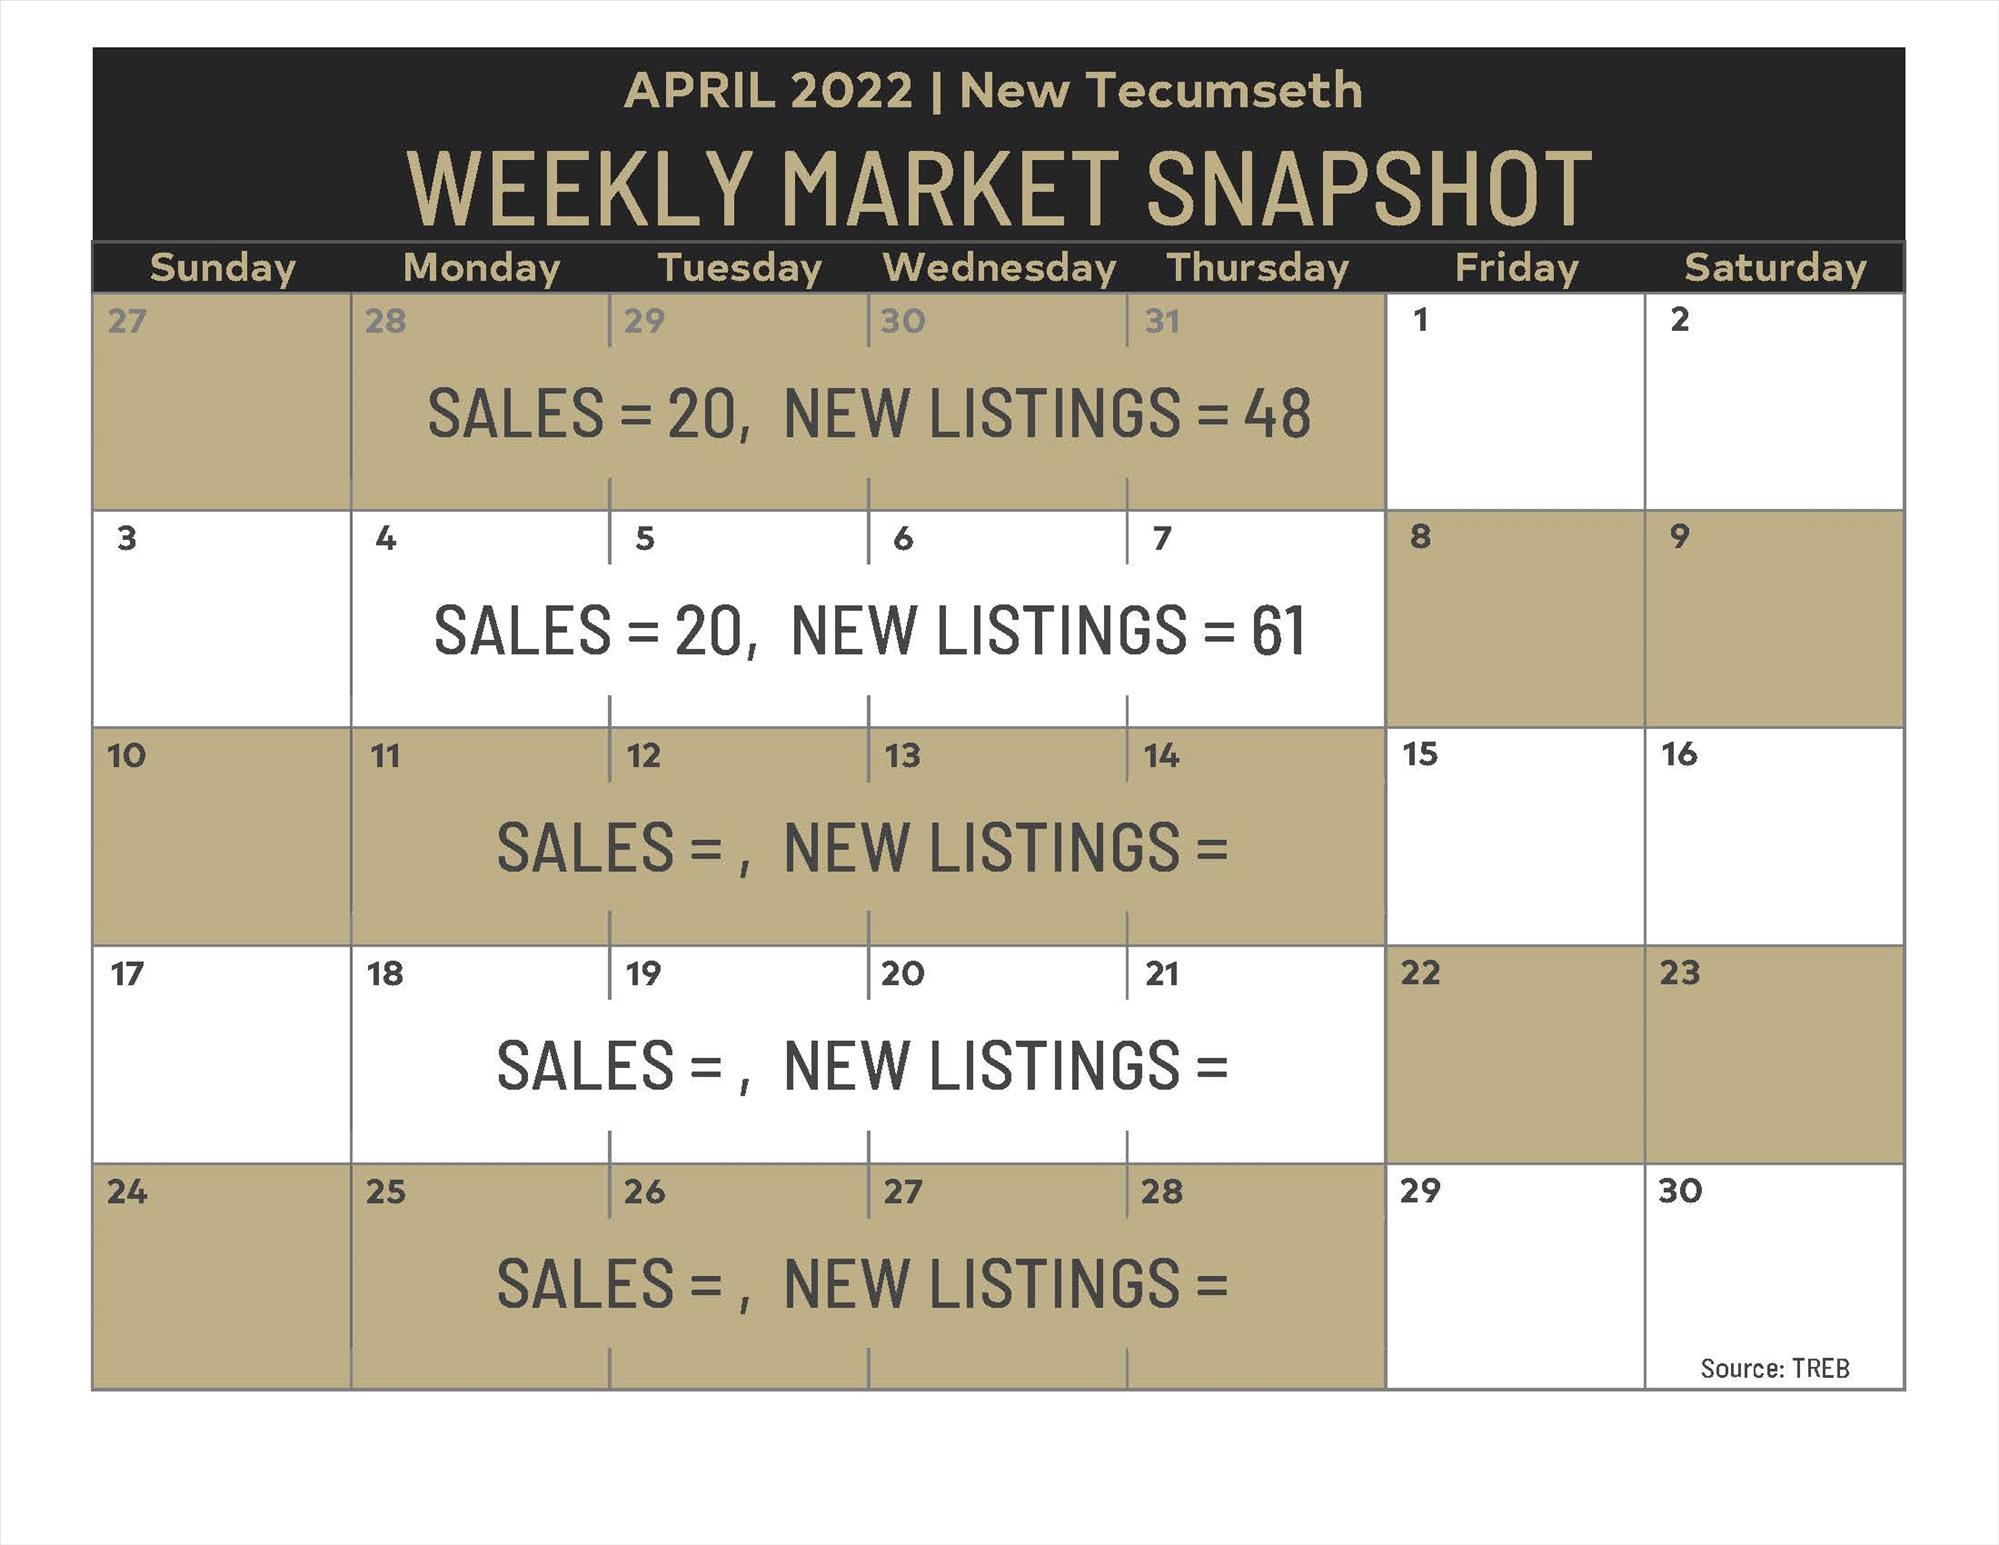
This market calls for weekly updates.
Mar 18-24 Stats:
Average Sold Price: $1,052,040
Average %Difference List Price vs Sale Price: 108%
Average Days on Market: 6
Mar 25-31 Stats:
Average Sold Price: $1,115,100
Average %Difference List Price vs Sale Price: 104%
Average Days on Market: 14
Apr 1-7 Stats:
Average Sold Price: $993,785
Average %Difference List Price vs Sale Price: 108%
Average Days on Market: 16
This is what a shifting market looks like! Market characteristics are changing as supply
and demand changes.
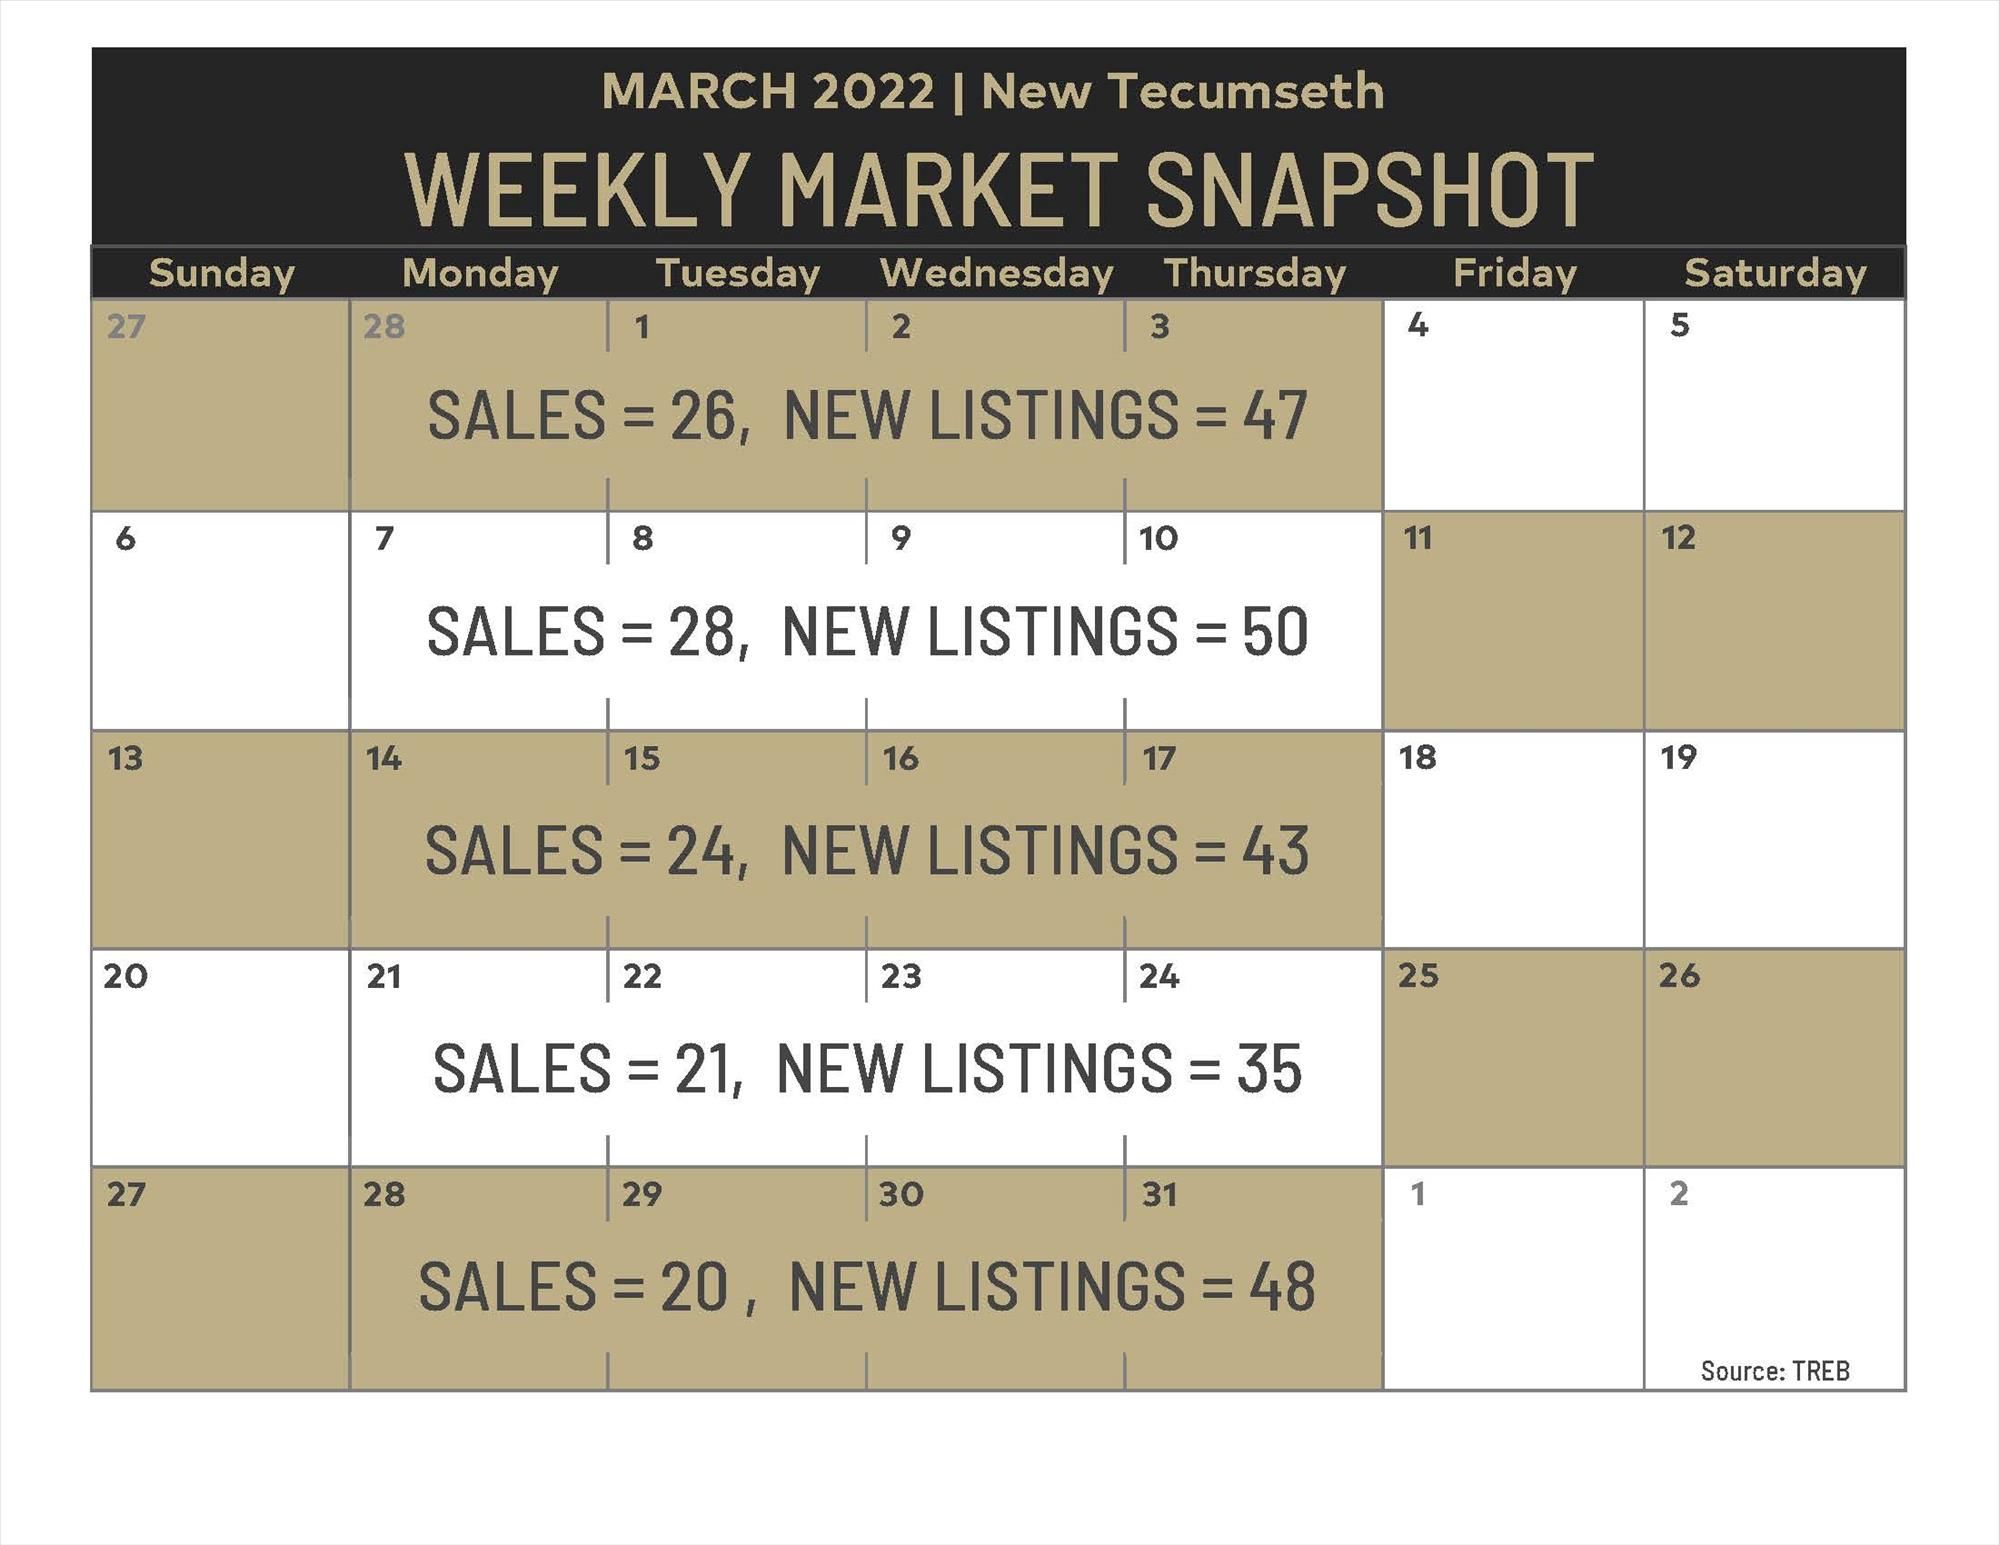
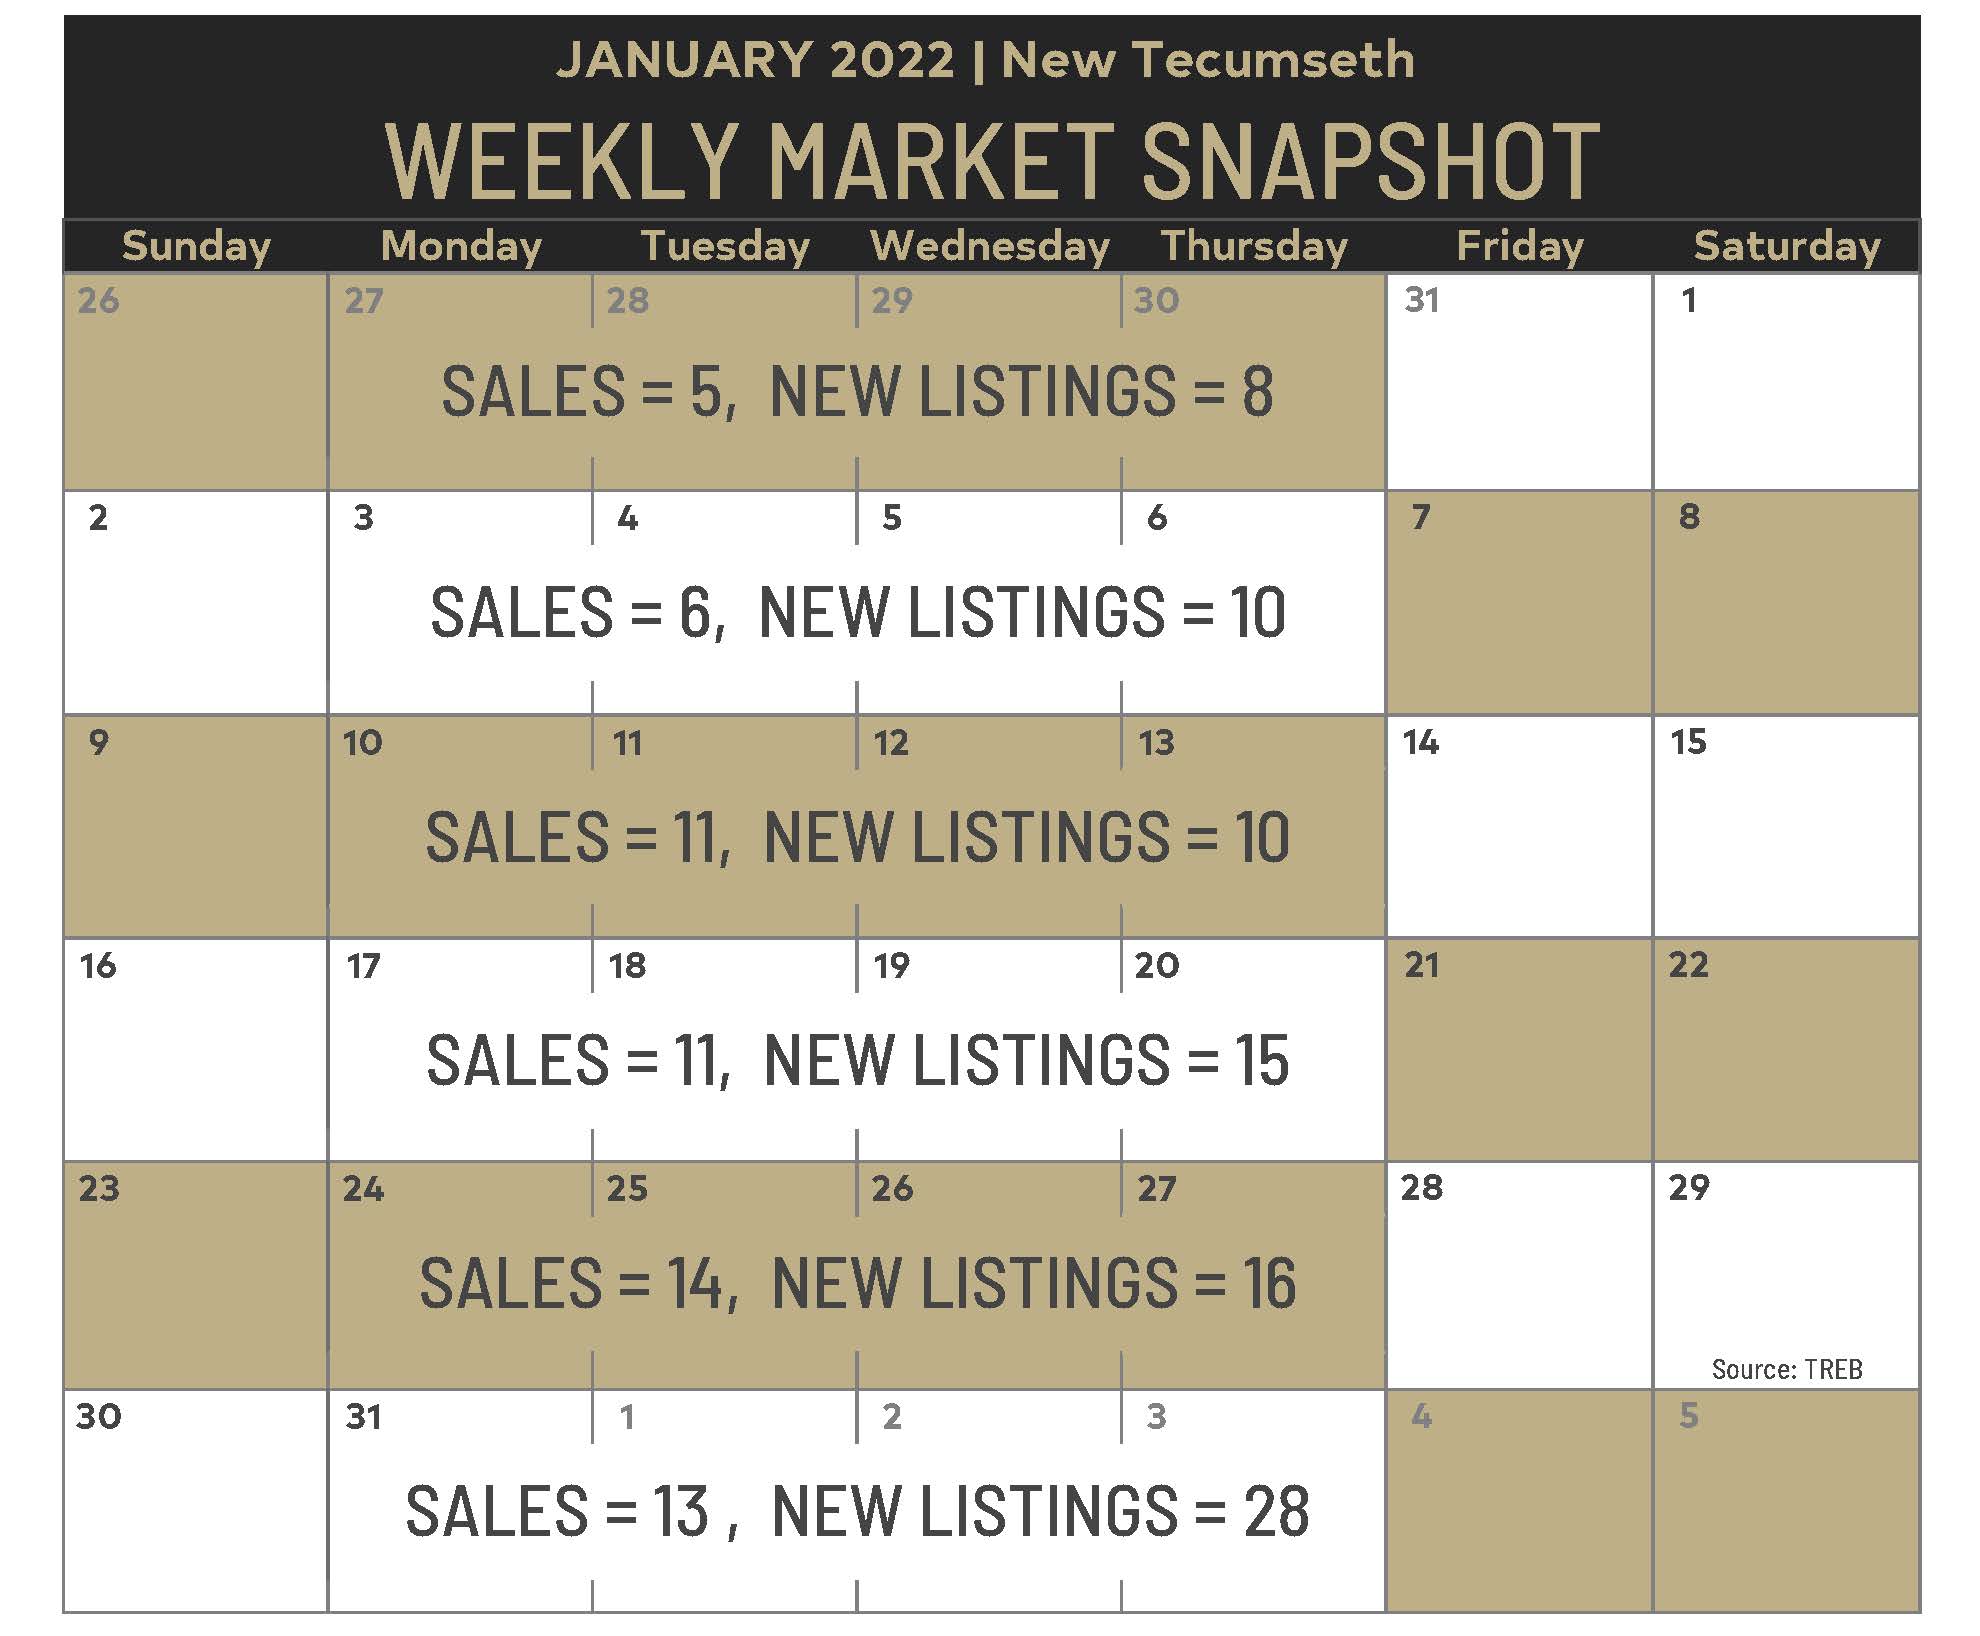
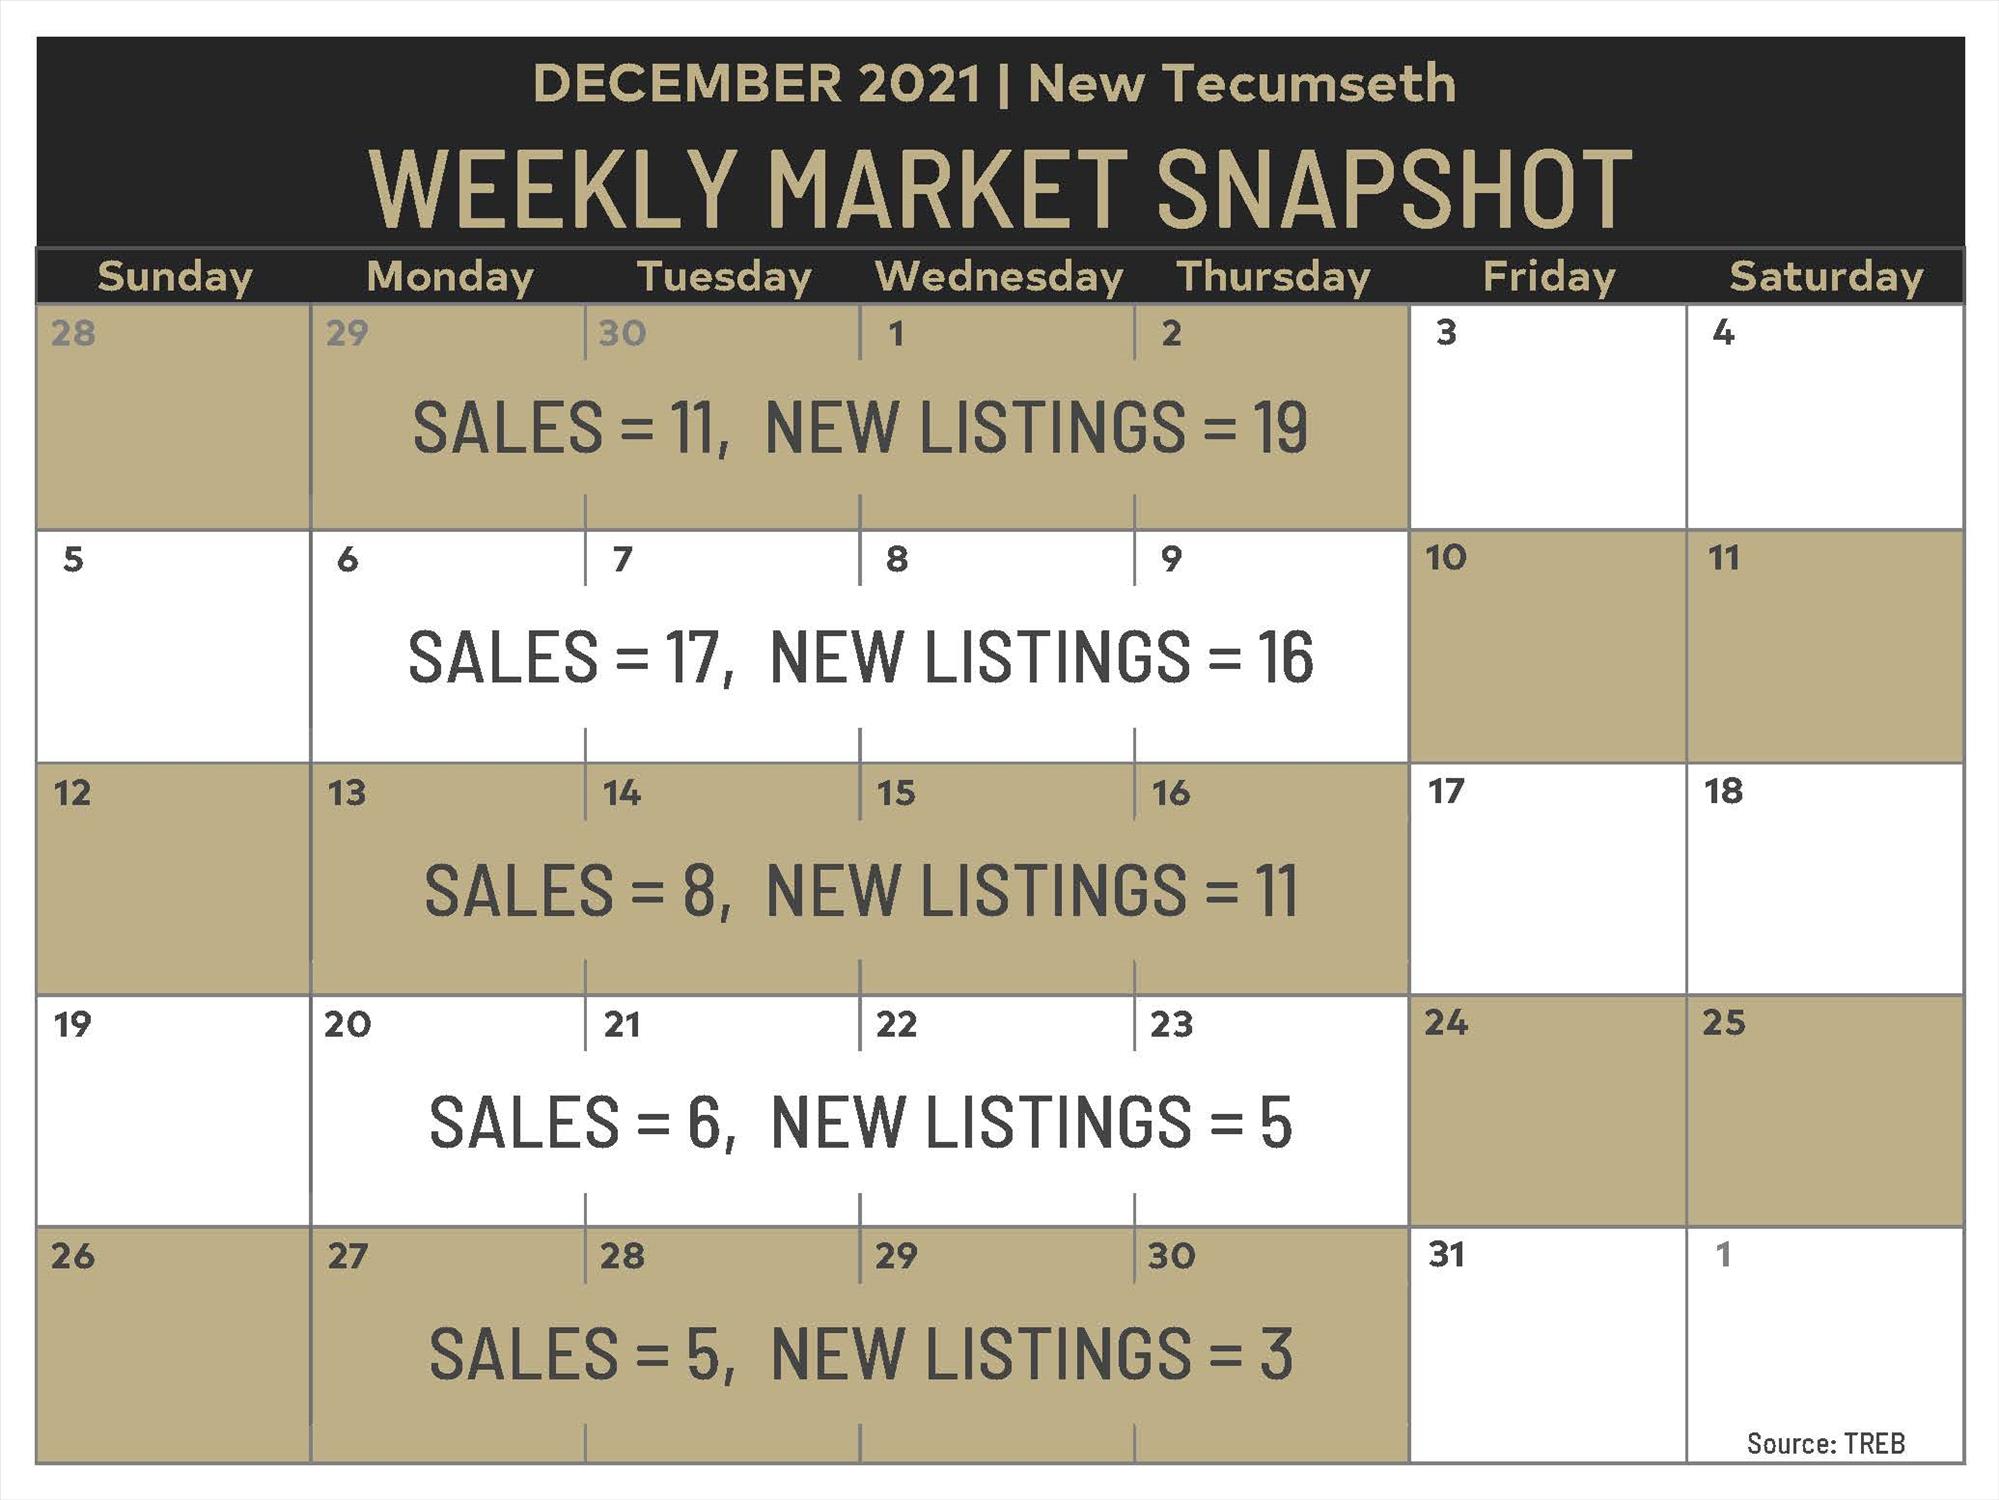
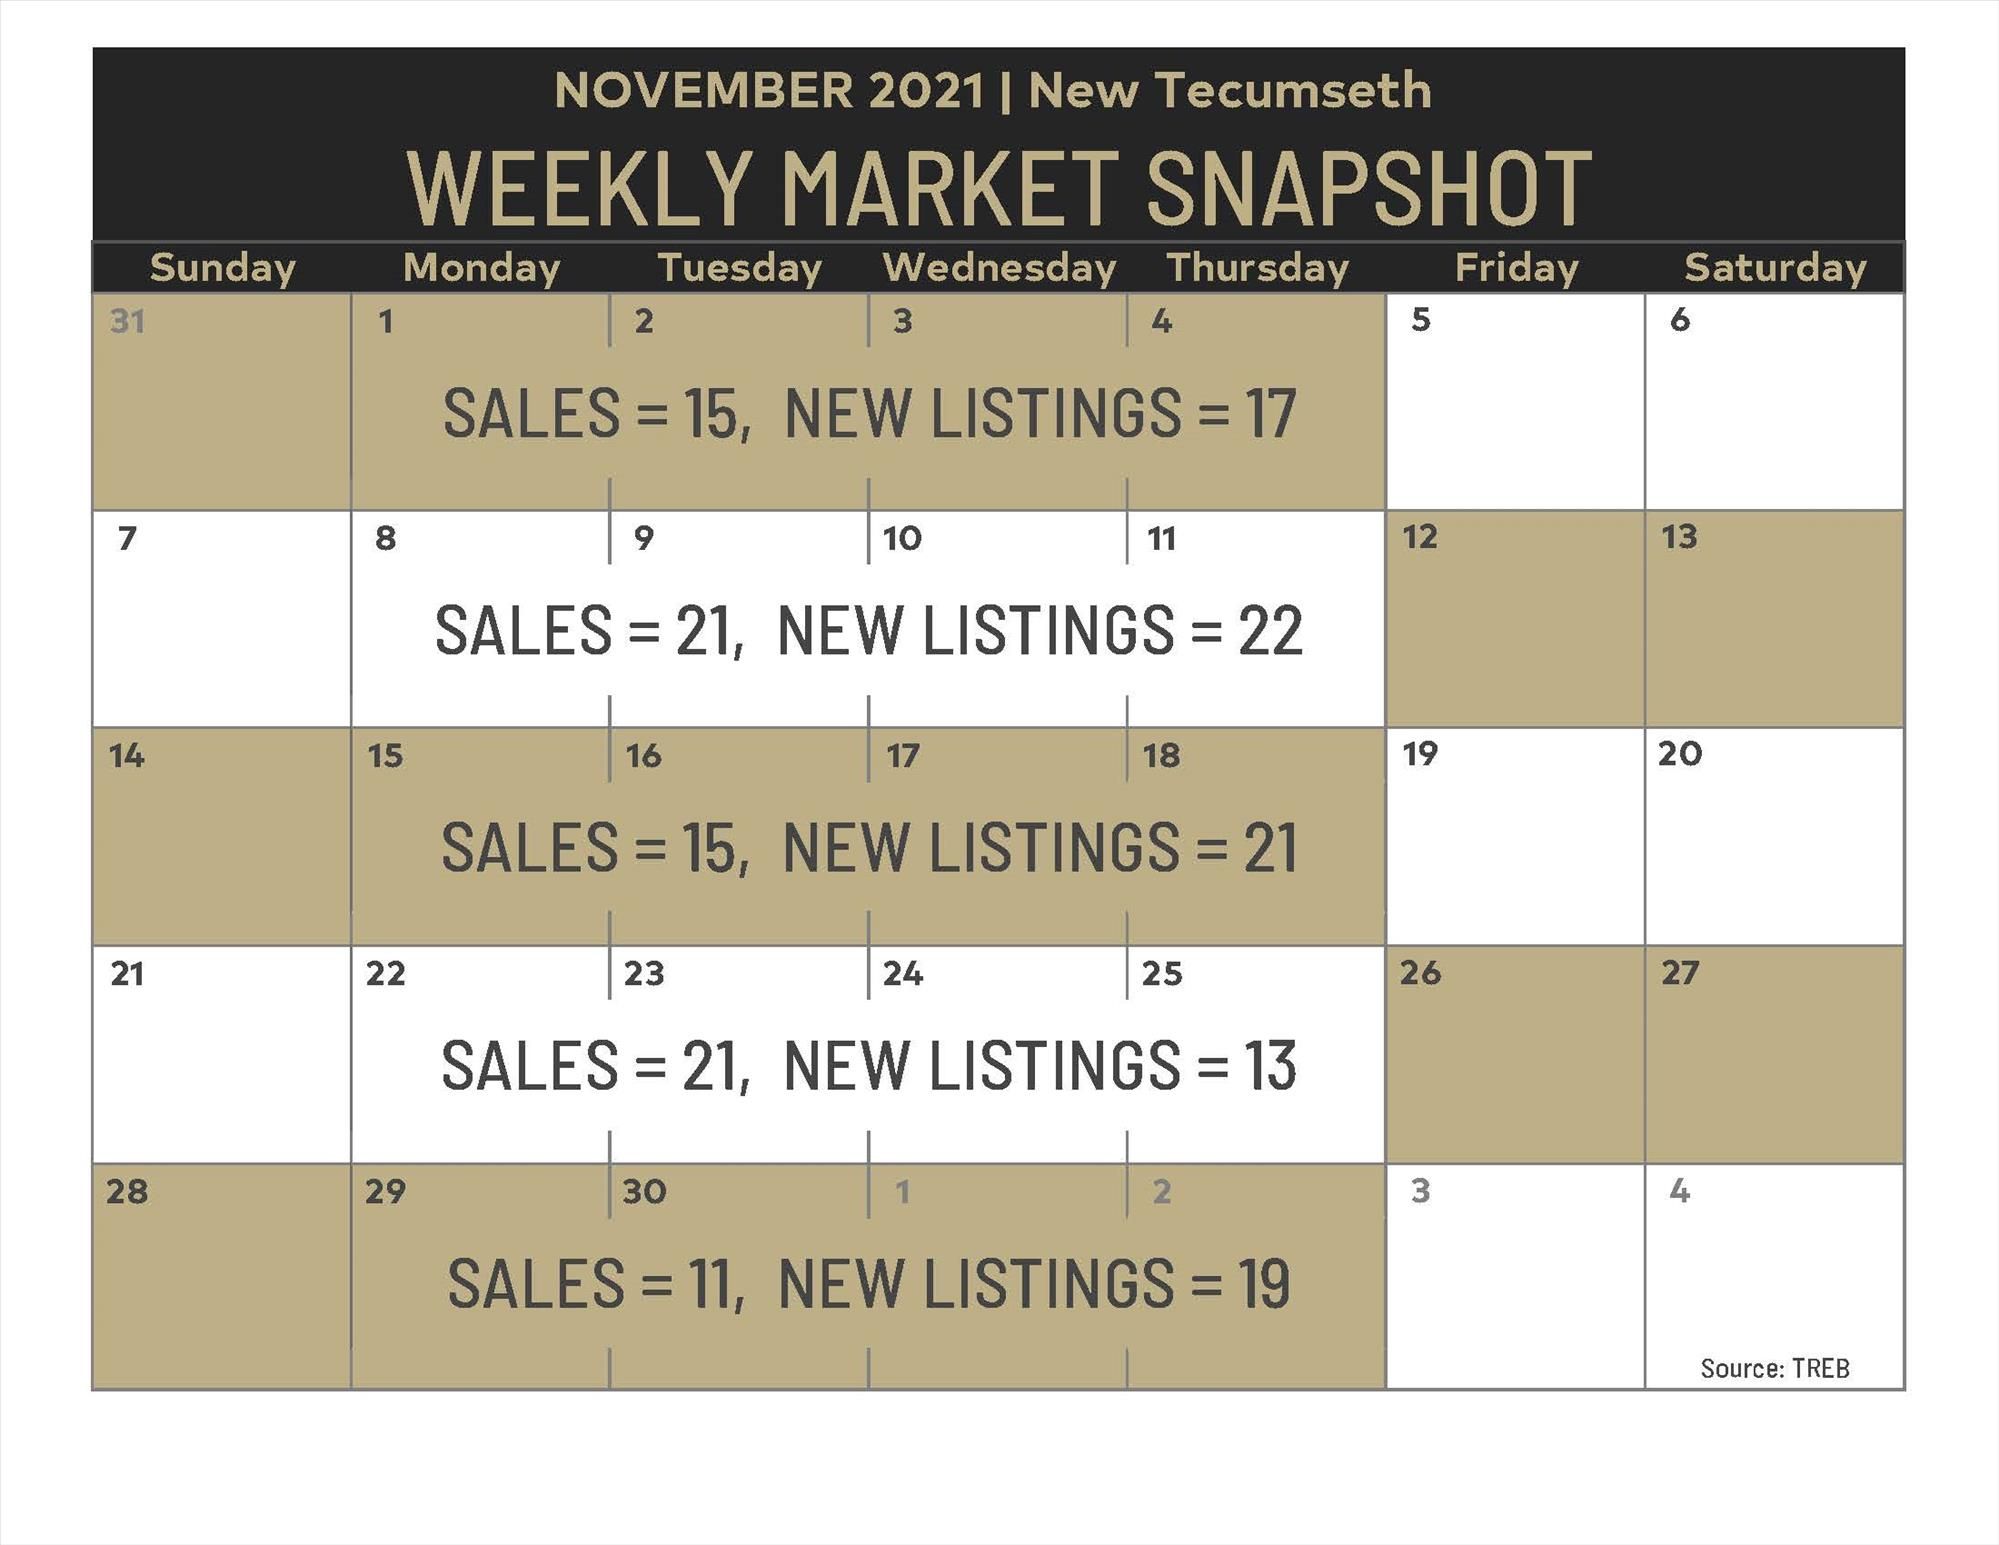
It is incredible to see so many homes come on the market!
It feels like just yesterday I was perpetually repeating “there is not enough
homes available”. Well look at these
numbers!
Interesting to see the difference to between Sales vs New
Listings. Sales are steady, but well
below New Listings.
Sales strategies have to shift now too. Holding offers, Offer Nights and bidding wars
with multiple offers is not the standard strategy anymore, and when attempted,
sometimes fail. Much more common now we
are seeing properties listed around "market value" and sellers
"accepting offers any time".
It is still a good time to sell. Prices are are near their highest level,
demand is healthy, but active listings are climbing. If you know anyone considering selling, have
them contact me to discuss this opportunity.
If you’re buying, tides have turned! Stay strong, be
aggressive and stick to your goals! As
the warm weather comes and interest rates climb there are "deals" to
be had.
Please let me know if I can help in anyway, I’m here to
serve.
Be well everyone.
